Written by Andrew Stone, Data Analyst
Following extraordinary growth for several years, prices are down in recent months. This will be of no surprise to any of you who have recently been in the process of buying or selling.
Since January 2020, house prices increased by about 30% across Nelson Alexander’s 16-office trade area*. The Melbourne property market thrived through a period of societal turmoil. The heat started to come out of the market towards the end of last year, and prices have softened since then for a number of reasons–
- Supply eventually caught up with demand as restrictions loosened
- Inflation has taken hold globally, and interest rates are rising accordingly
- Borrowing capacities are falling, and purchase budgets with them
- Consumer confidence is low, and more people are sceptical about near-term property price directions.
Price trends over the last few years are shown in graph form below. The rolling 12-month median is the slow-moving black line. Every point on the graph represents 12 months’ worth of sales activity and is most useful for understanding long-term trends.
The rolling 3-month median in red fluctuates more and is useful for understanding recent trends as it takes in just 3 months’ worth of sales activity at each point on the graph.
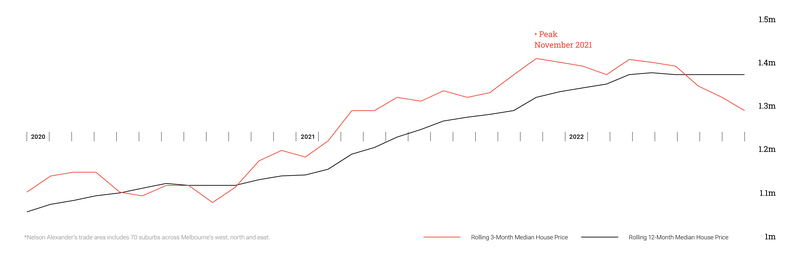
Notice how the black line tends to follow the direction of the red line. When the 3-month median is higher, then the 12-month median rises, and vice versa. Price growth throughout 2021 was so strong because the gap between the 3-month and 12-month median prices remained so wide.
The red line peaked in November 2021 and has gradually decreased to now. Over that period, the black line has flattened, and it will undoubtedly fall in the coming months as it follows the direction of the 3-month red line.
What does all this mean?
House prices remain much higher than they were a few years ago, but they have dropped in recent months. The +/- 10% fall in prices since November that we’re seeing in the stats aligns with anecdotal information we gather from agents and from property inspections across Melbourne.
One caveat to this relates to newly renovated or newly built homes, which continue to sell under competition between multiple buyers. Construction costs have escalated dramatically over the last year (though they’ve stabilised recently) and many renovations and build projects are on hold. The supply of modern houses will likely decrease further in the coming months, and we anticipate this part of the market to outperform others.
For further information on how your property is placed in today’s market, visit our latest Suburb Report here, fill out the form below or reach out to any of Nelson Alexander’s agents for a confidential discussion.
*Nelson Alexander’s trade area includes 70 suburbs across Melbourne’s west, north and east.