This year has had a monumental impact on the real estate industry, and with light at the end of the tunnel near approaching, we spoke with our friends at Property Analytics to gain industry insight into how the market is tracking.
The question we are often asked; what is the market doing?
For most people, this question translates to: how are prices trending (and, what does this mean for my property/portfolio). Everyone wants a simple X% answer.
In normal circumstances, we try our best to provide it, but in these tumultuous times, with so many dramatic and often contradictory figures reported through the media, the most responsible thing to do is this: show you the facts in graph format and help you interpret them for yourselves.
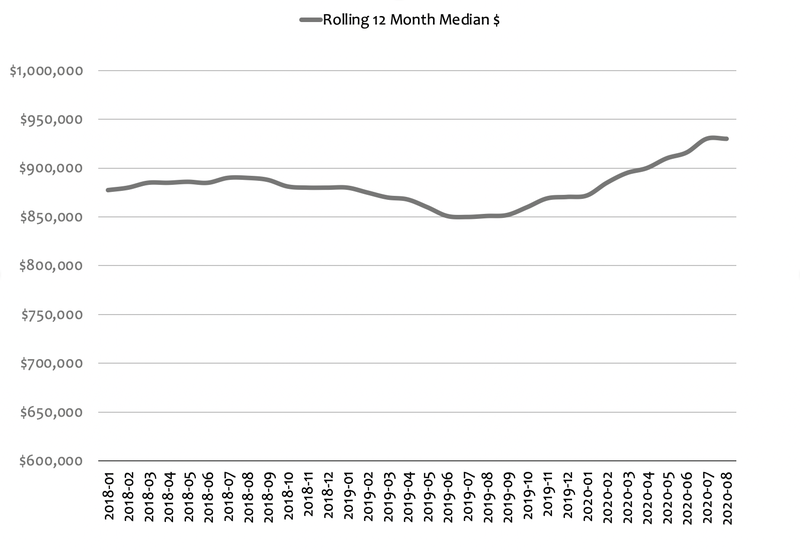
Measuring median dollar house prices over rolling 12-month periods deliver highly credible results because of a large number of sales accounted for. Each figure on the below graph represents 12 months’ worth of sales data (e.g. the 2020-08 figure of $930,000 accounts for all sales from 2019-09 to 2020-08).
Rolling 12-month medians are useful for conducting long-term trend analyses and for providing important historical context, but they’re not incredibly helpful in identifying emerging trends.
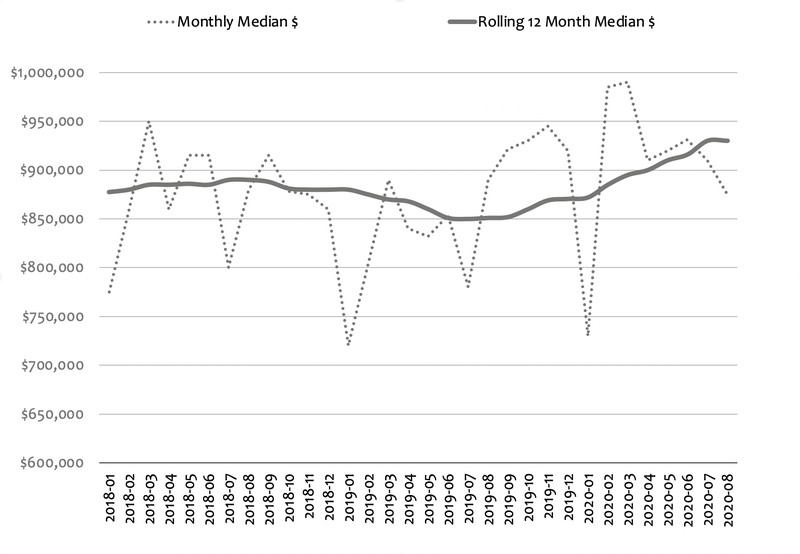
Measuring median dollar house prices on an individual monthly basis gives a more real-time perspective, but as you can see above, the figures jump around a lot due to seasonality, lower volumes, etc.
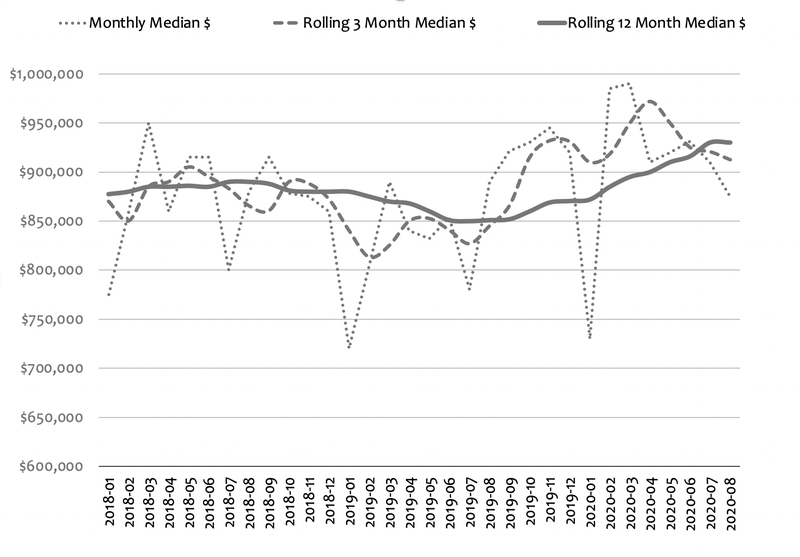
A third way of measuring prices is by rolling 3-month periods. This method provides a more current perspective than rolling 12-months while smoothing out the monthly bumps a bit. Seasonality and other factors still impact things, though – notice how the line ebbs and flows.
But, what does this all mean?
- The Rolling 12 Month Median shows us that prices are up 9% compared to the same time last year.
- The Monthly Median shows us that prices bottomed out in mid-2019 and then rebounded considerably through to March this year; COVID hit and prices dropped significantly from March to April (who wasn’t scared in those early days?!) and have remained pretty stable since.
- The Rolling 3 Month Median shows that prices have fallen about 6% from their peak in April.
This final graph provides some important context in the form of sales volumes.
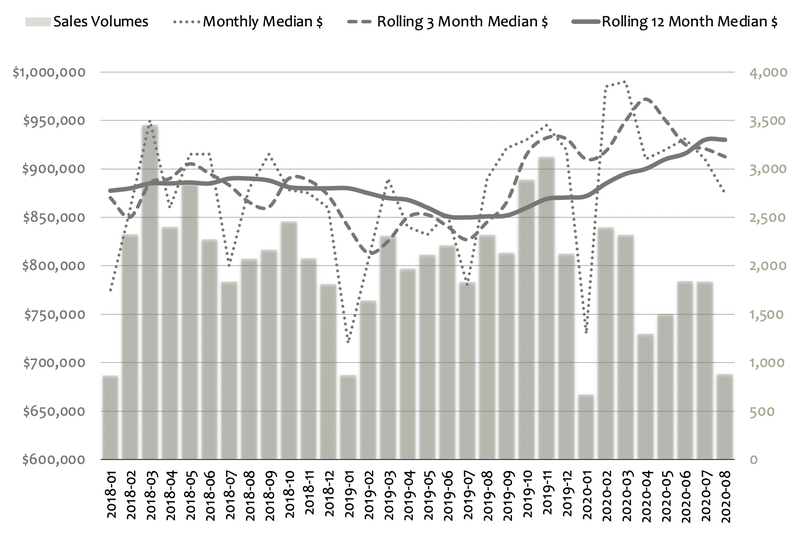
At first glance, the extreme drops in prices seen in January would be of concern, but the figures lack integrity because of very low volumes. The same applies to August this year when the industry basically shut down, and volumes were extremely low.
A final comment; sales volumes from April-July were down 34% compared to the previous year. No doubt, lower supply helped stabilise prices in recent months. As we move further into the last few weeks of Spring and the real estate industry begins to open up, more properties will come on the market for sale - much will depend on whether the pent-up buyer demand matches the increased supply. Leading indicators such as online searches, enquiries, and private inspection numbers confirm that buyers are very active already.
Looking forward, where is the market headed?
Nobody is seriously predicting strong price growth in the near term, but an examination of previous severe economic shocks points to reasons for optimism.
During the economic crisis of the early 1990s, Melbourne house prices dropped 8%. During the Global Financial Crisis in 2008, prices fell by 4%. The below graph shows how Melbourne prices were trending, leading into each crisis.
The Melbourne real estate market was booming leading into both, with robust year-on-year growth of rolling 12-month median $ house prices.
Conditions were very different, leading into this COVID Crisis. The market had only just started to recover from the sharpest price falls in living memory.
In the absence of a global pandemic, we would be in a very different market right now. Once some normalcy returns, expect natural cyclical forces to reassert themselves.